Nov 12, 2026
A Sieve Test Can Be Inaccurate Before the Machine Starts
When sieve analysis results vary between tests, laboratories often begin by checking the sieve mesh, vibration settings, or screening duration.
However, the source of the problem may exist before the sample reaches the sieve shaker.
Powders can segregate during transportation, storage, and handling. Differences in particle size, density, shape, and surface properties may cause coarse and fine particles to become unevenly distributed within a container.
If a technician collects a test portion from only one accessible location, the sample may not represent the original batch.
For QC engineers and procurement teams, representative sampling is an essential part of particle size analysis, not simply a preliminary handling step.
A properly operated sieve shaker cannot compensate for a sample that does not represent the material being tested.
How the Brazil Nut Effect Causes Powder Segregation
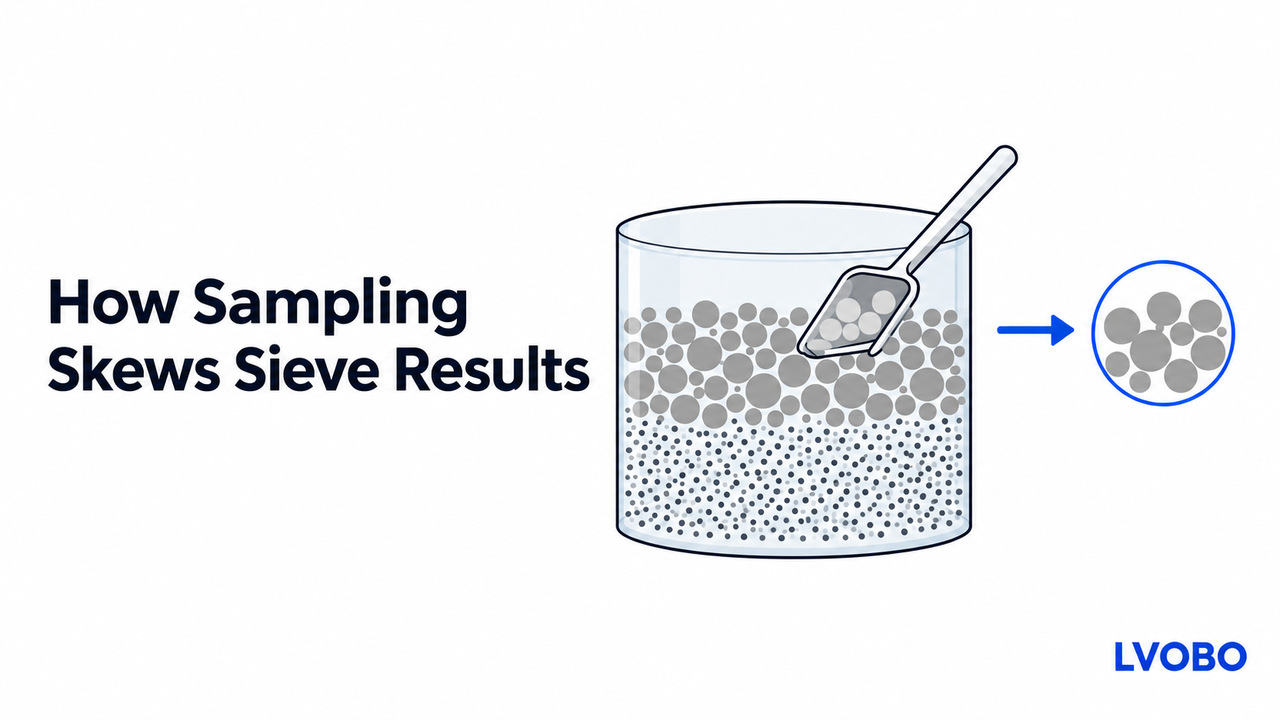
One well-known example of granular segregation is the Brazil Nut Effect.
When a mixture of particles experiences repeated vibration or movement, larger particles may migrate toward the upper region while smaller particles move into the spaces below.
This phenomenon is familiar from a container of mixed nuts: larger nuts often appear near the top after transportation or shaking.
A similar effect can occur in industrial powders and granular materials.
However, particle segregation is more complex than simply saying that large particles always rise.
Several factors influence particle movement:
Particle Size Ratio: Differences in particle dimensions affect how smaller particles move through spaces between larger ones.
Density Contrast: Differences in particle density can influence the direction and rate of segregation.
Particle Shape: Irregular and elongated particles may move differently from spherical particles.
Vibration Conditions: Frequency, amplitude, vibration intensity, and duration can influence particle migration.
Surface and Environmental Conditions: Friction, moisture, cohesion, and container geometry can also affect segregation.
Under certain conditions, the opposite behavior, known as the Reverse Brazil Nut Effect, can occur, causing larger particles to migrate downward.
There is no universal rule that predicts segregation direction from vibration frequency or density alone. These variables interact with the particle system and operating conditions.
Why Does This Matter for Laboratory Testing?
A sample collected from the top of a container may contain a different proportion of coarse and fine particles than one collected from the middle or bottom.
The resulting particle size distribution may therefore reflect the sampling location rather than the actual composition of the entire batch.
4 Common Sampling Mistakes That Distort Sieve Analysis Results
Even when the sieve shaker operates correctly, poor sampling practices can introduce significant variation.
The following comparison highlights four common mistakes, their consequences, and the corresponding corrective procedures.
Mistake
Consequence
Correct SOP
Top-Surface SamplingCollecting powder only from the top of a bag or drum.
The sample may contain an unrepresentative proportion of coarse or fine particles due to segregation.
Collect increments from multiple representative locations using a suitable sampling device or defined sampling procedure.
Single Grab SamplingTaking one scoop from one accessible location.
Local particle distribution may not represent the entire production batch.
Collect multiple increments and combine them into a composite sample when appropriate.
Ignoring Transportation EffectsOverlooking vibration, handling, and storage history.
Previously uniform powders may become segregated during transportation or storage.
Document material history and apply a validated sampling or homogenization procedure where necessary.
Uncontrolled Sample SplittingReducing bulk material through arbitrary scooping or unsuitable manual methods.
Coarse and fine fractions may become unevenly distributed in the final test portion.
Use a suitable riffle splitter, chute splitter, or rotary sample divider where appropriate. Validate the splitting method for the material.
QC Consideration: Traditional cone-and-quartering is not automatically unsuitable. However, for fine, cohesive, electrostatic, or segregation-prone powders, manual splitting may introduce additional operator-dependent variation. A suitable mechanical divider can provide better control when its use has been validated.
5 Steps to Obtain a More Representative Powder Sample
A reliable sieve analysis procedure begins with controlled sampling and sample preparation.
Step 1: Collect Samples from Representative Locations
Whenever practical, sample powder while it is moving during transfer or discharge.
Collect multiple small increments across the material stream rather than relying on one large scoop from a single location.
For packaged materials, use a suitable sampling device that can reach defined positions within the container.
Step 2: Prepare a Composite Sample
Combine the collected increments to form a representative primary sample.
This helps account for variations between different sampling locations or collection times.
Step 3: Reduce the Sample Using a Suitable Divider
Use a suitable riffle divider, chute splitter, or rotary sample divider to obtain the required test portion.
The objective is to preserve the relative proportions of different particle fractions during sample reduction.
For fine or cohesive powders, verify that the selected divider does not introduce material loss, blockage, or additional segregation.
Step 4: Prevent Loss of Fine Particles
Fine particles may be lost during transfer, remain attached to container surfaces, or become airborne during handling.
Use clean, suitable containers and controlled transfer procedures. Protect samples from moisture changes, contamination, and unnecessary material loss.
Even small changes in sample composition can influence the reported particle size distribution.
Step 5: Verify Results Using Independently Prepared Test Portions
If repeated sieve tests produce substantially different results, prepare additional test portions using the same controlled sampling and splitting procedure.
Compare the results before assuming that the sieve shaker requires recalibration.
This helps distinguish sampling variation from differences in the screening process.
What a Laboratory Sieve Shaker Can—and Cannot—Control
Representative sampling establishes the quality of the test portion. The next step is to control the mechanical screening process itself.
Even when a sample is properly prepared, inconsistent equipment motion, screening duration, or operating procedures can introduce additional variation.
Controlled mechanical vibration helps reduce equipment-related testing variation by making screening conditions more consistent and repeatable.
A laboratory sieve shaker can control important operating conditions, but it cannot correct an unrepresentative sample or guarantee identical results for every material.
For this reason, sample preparation and sieve operation should be managed as two separate quality control stages.
Repeatable Screening with LVOBO Laboratory Sieve Shakers
Once sampling representativeness has been established, selecting equipment with controllable and repeatable mechanical motion becomes the second important step.
LVOBO laboratory sieve shakers, including the BO-200SY and BO-300SY, are designed for laboratory particle size analysis, powder classification, and sieve residue testing.
The upgraded BO-SY control system provides several functions to help laboratories standardize screening procedures.
Forward and Reverse Motion: Adjustable forward and reverse motion modes allow laboratories to configure different screening patterns according to material characteristics and testing requirements.
Adjustable Vertical Vibration: Vertical vibration intensity can be adjusted to accommodate different powder screening requirements.
Programmable Screening Procedures: The touchscreen controller allows users to configure operating time, cycle settings, and motion conditions for different materials.
21 Screening Program Memories: Up to 21 screening programs can be stored and recalled, helping laboratories maintain consistent operating procedures across different samples, operators, and testing sessions.
These functions help laboratories control the mechanical screening stage after a suitable test portion has been prepared.
The objective is not to compensate for poor sampling, but to reduce variation caused by inconsistent screening conditions.
Pre-Test QC Checklist for Laboratory Engineers
Before starting a sieve analysis test, review these five conditions:
☐ Sampling Location: Was the sample collected from representative locations rather than only from the container surface?
☐ Transportation History: Could vibration, handling, or storage have caused particle segregation?
☐ Sample Mass: Is the test portion appropriate for the material and selected sieve procedure?
☐ Sample Reduction: Was the test portion prepared using a suitable and controlled splitting method?
☐ Testing Conditions: Are sieve apertures, motion settings, screening duration, and operating procedures defined?
If any of these conditions are uncertain, investigate them before attributing inconsistent results to the sieve shaker.
Reliable Sieve Analysis Starts Before Screening
Accurate particle size analysis depends on more than a calibrated sieve stack.
Sampling procedures, particle segregation, sample reduction, and material handling all influence the quality of the test portion.
The Brazil Nut Effect demonstrates how granular materials can change their spatial distribution during transportation and vibration.
First, prepare a representative sample. Second, establish controlled mechanical screening conditions.
By standardizing both stages, laboratories can improve the reliability of batch comparisons, supplier qualification, incoming material inspection, and powder quality control.
Technical References
ISO 14488:2007 — Particulate materials: Sampling and sample splitting for the determination of particulate properties.
ASTM E2651-25 — Standard Guide for Powder Particle Size Analysis.
ASTM B215-20(2025) — Standard Practices for Sampling Metal Powders.
Read More
 English
 English
 Español
 Tiếng Việt



 3rd Floor, Building 8, Licheng Science and Technology Innovation Center, No. 188 Taixin Street, Licheng District, Quanzhou City, Fujian Province, China
 Tel : +86 -13788824251
 Email : lvobo2026@gmail.com
 WhatsApp : +86 -13788824251


 IPv6 Network Supported